GreenTree Thessaloniki
A web application for recording and managing tree data in urban areas with interactive mapping, species distribution visualization, and statistical analysis dashboards. Built the user-facing form and data entry workflow that enables field workers to efficiently capture and categorize tree data.
Frontend Developer
Screenshots
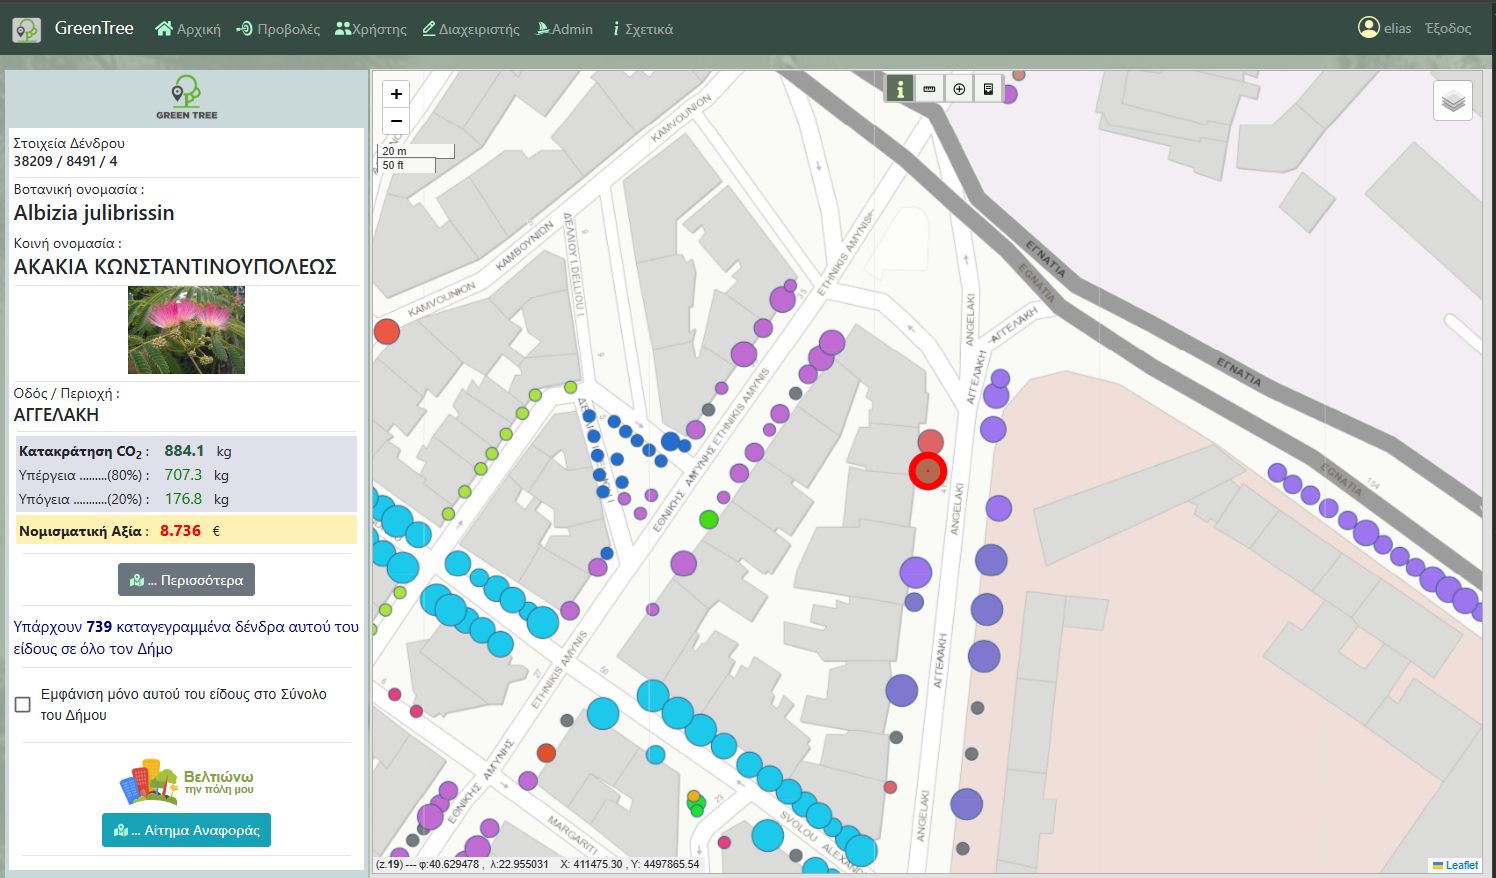
City Trees Map Overview
Interactive city map displaying all recorded trees, color-coded by species and scaled marker size based on tree dimensions, with a side panel showing key details for the selected tree.
City Trees Map Overview
Interactive city map displaying all recorded trees, color-coded by species and scaled marker size based on tree dimensions, with a side panel showing key details for the selected tree.
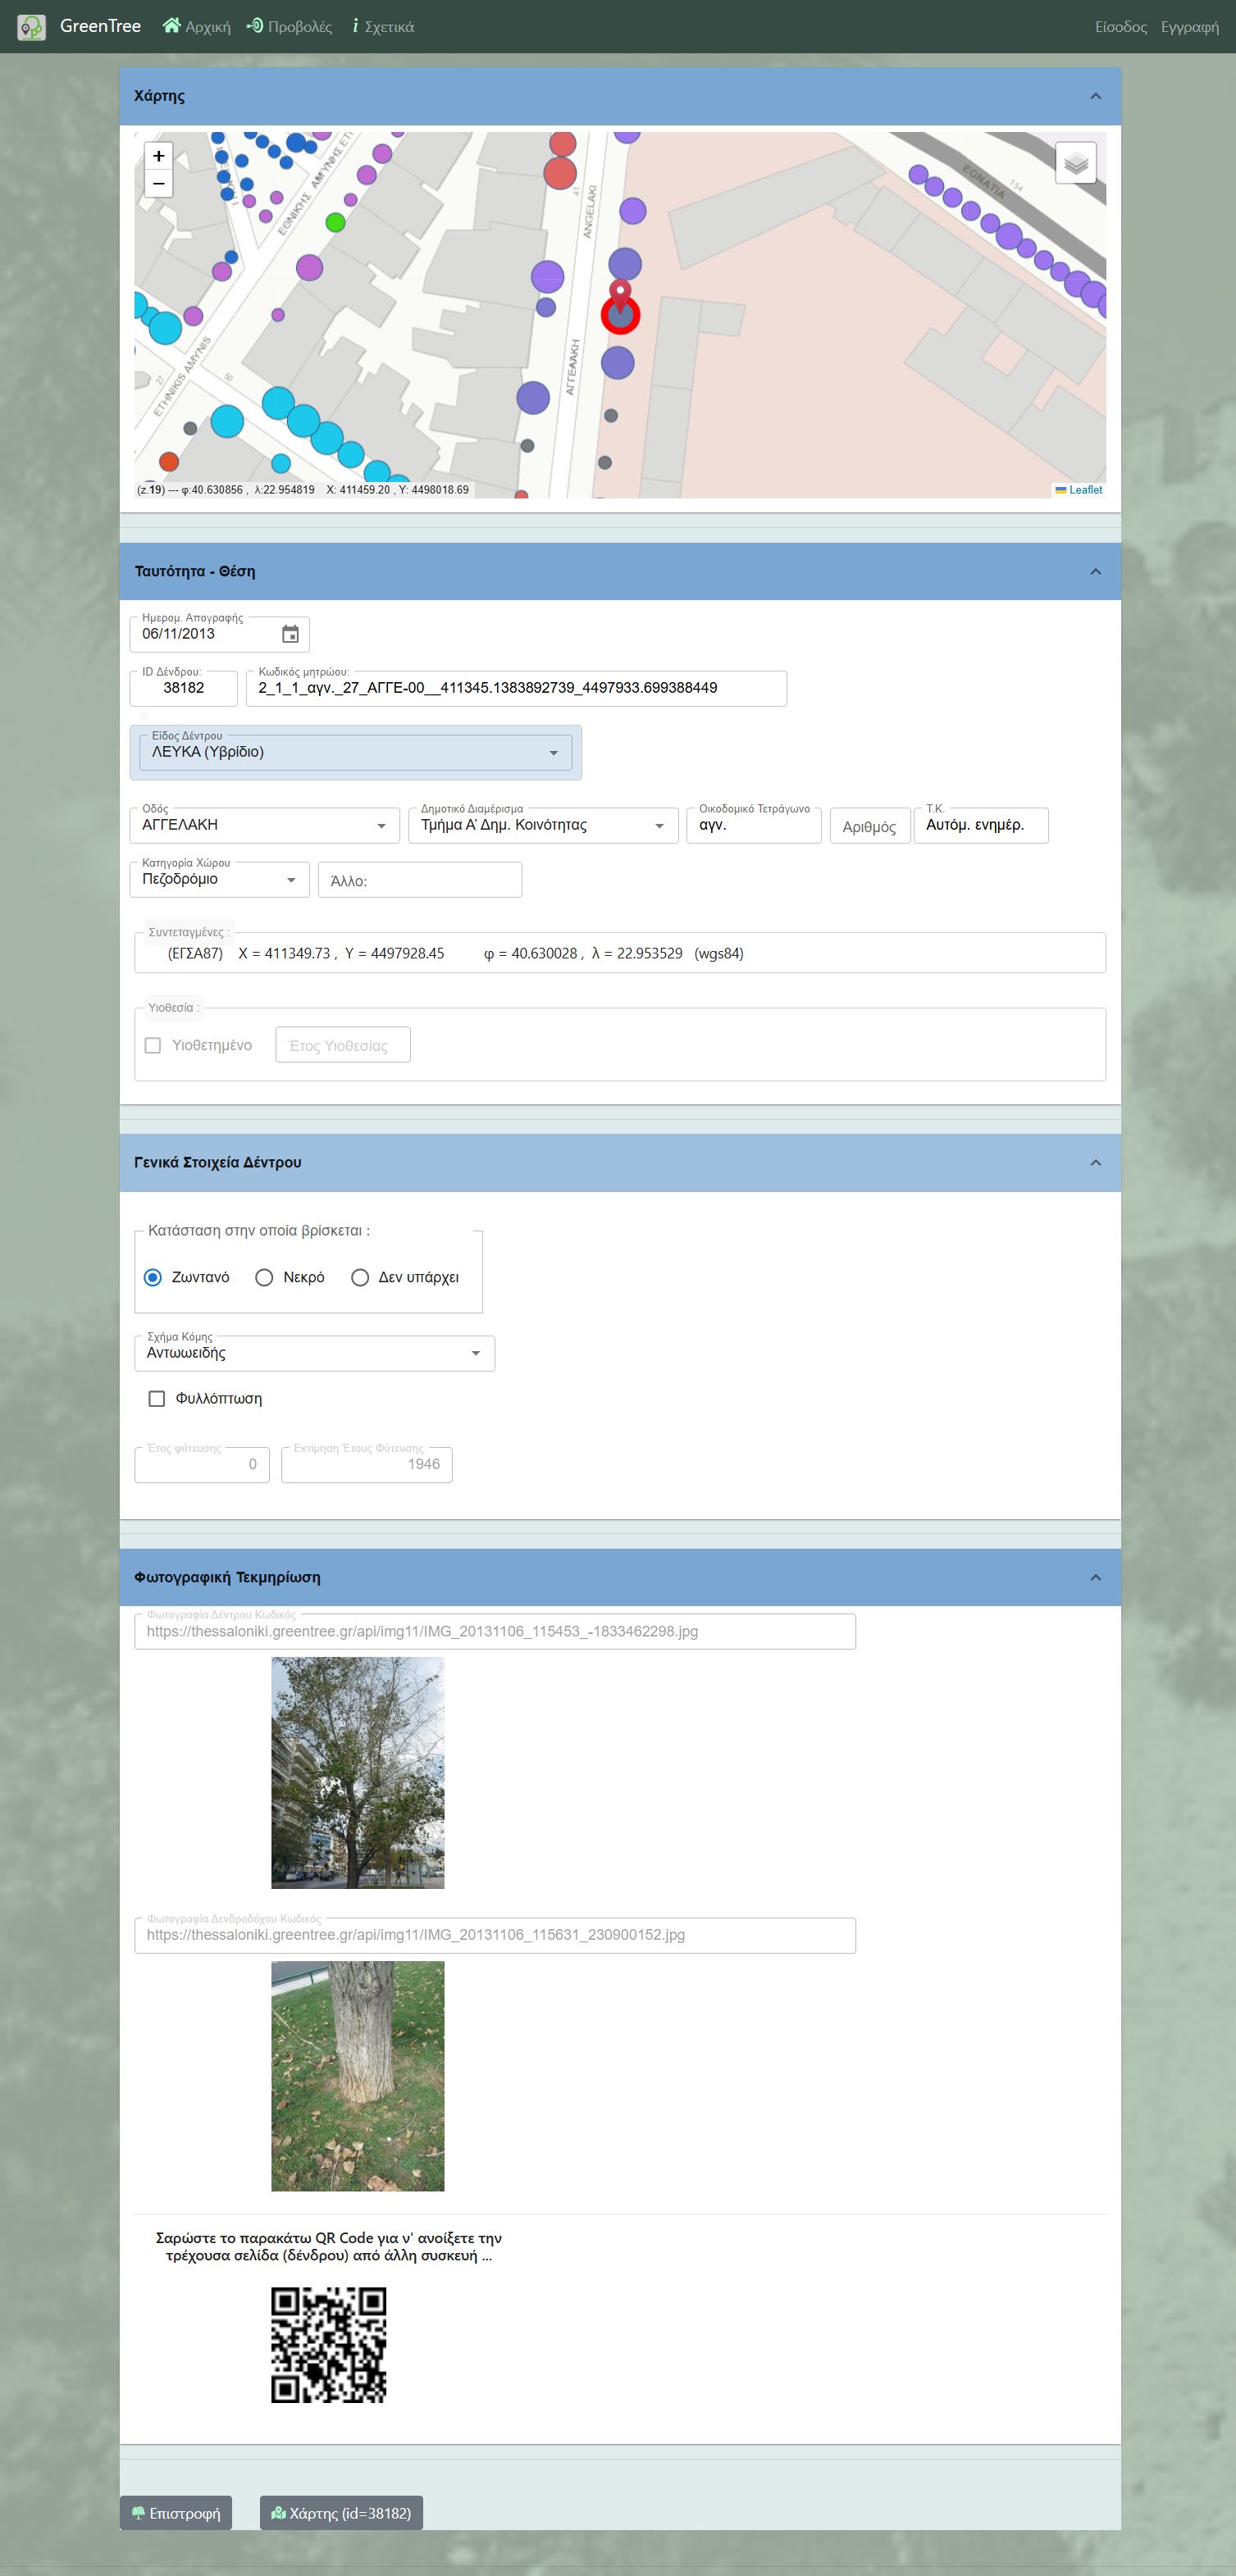
Tree Detail View
Comprehensive profile of a selected tree including location, biological data, condition, photographs, and QR code access for field identification.
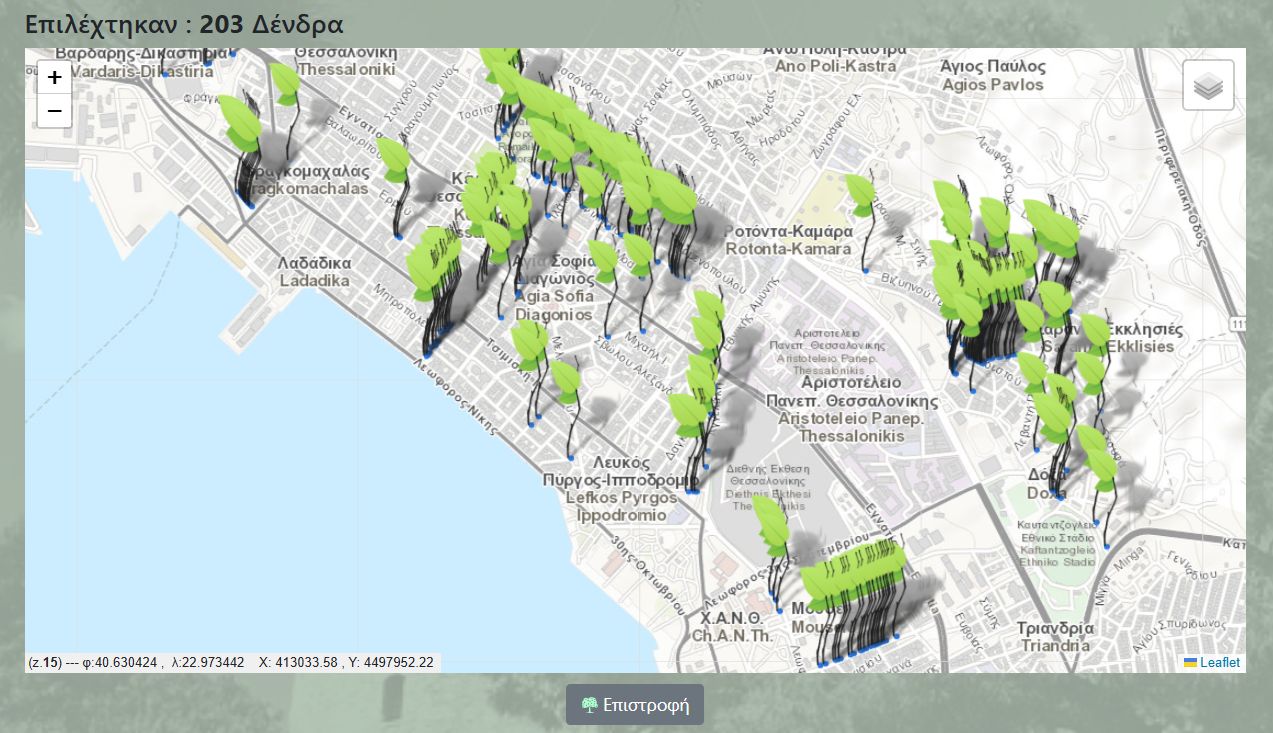
Species Distribution Map
Geospatial visualization showing the spatial distribution of a specific tree species across the city.
Species Distribution Map
Geospatial visualization showing the spatial distribution of a specific tree species across the city.
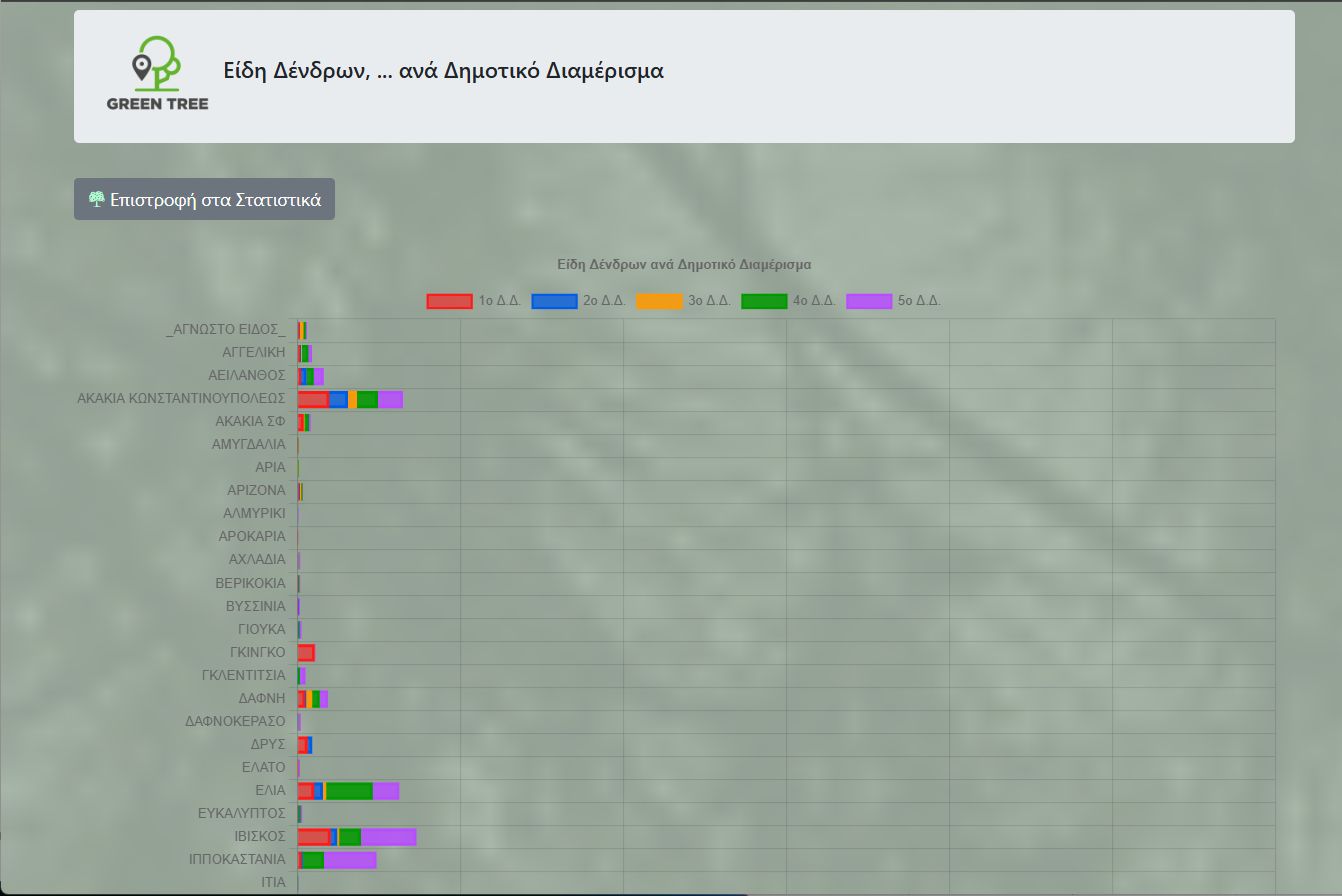
Tree Species Statistics by Municipal District
Statistical breakdown of tree species counts per municipal district, presented in a comparative bar chart format.
Tree Species Statistics by Municipal District
Statistical breakdown of tree species counts per municipal district, presented in a comparative bar chart format.
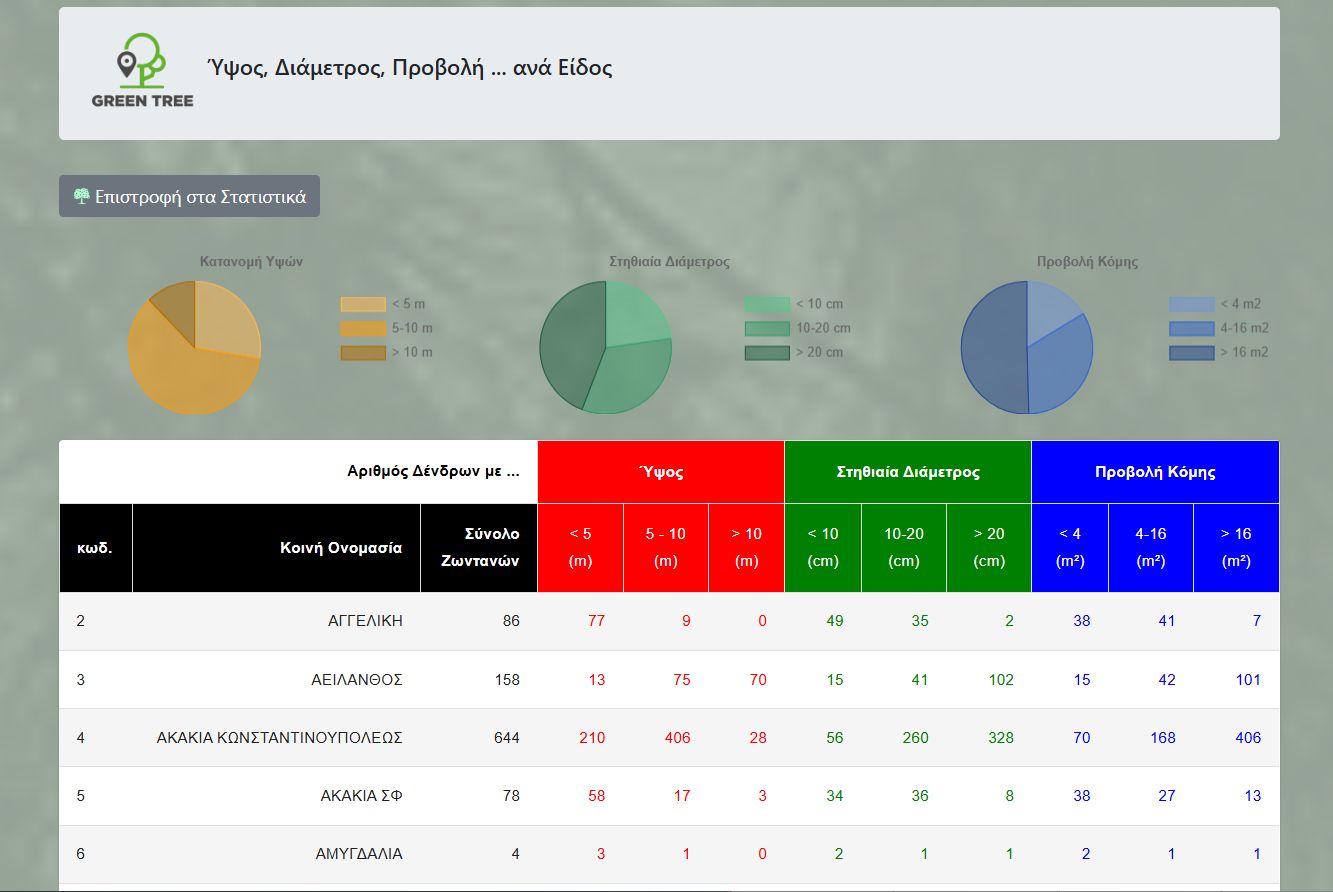
Height, Diameter, and Canopy Statistics by Species
Analytical dashboard presenting aggregated statistics for tree height, trunk diameter, and canopy spread per species using charts and detailed tables.
Height, Diameter, and Canopy Statistics by Species
Analytical dashboard presenting aggregated statistics for tree height, trunk diameter, and canopy spread per species using charts and detailed tables.
Challenge
Creating an intuitive data entry interface for field workers while integrating map functionality with data collection.
Solution
Designed mobile-responsive forms with validation and implemented interactive map with data visualization for geospatial analysis.
Results
- Streamlined field data collection workflows
- Enabled geospatial visualization of urban tree data
- Provided analytical dashboards for decision-making
Interested in a Similar Project?
Contact for quote — I'll help you design and build a solution tailored to your needs.
Let's Talk